Ecological Arbitrage: The Three Numbers Leading Investors Use to Rerate Desert Solar

Executive Summary
Solar in deserts extends beyond cheap land and abundant sun. Field operations reveal dynamics that standard financial models rarely capture. Three numbers reshape the economics: 3–6 years for ecological recovery, 10–15% O&M savings from managed vegetation, and 10–30 basis points off debt through sustainability-linked loans. Field evidence from dozens of projects supports these patterns—results vary by site conditions, but directional trends persist.
Number 1: 3–6 Years
The Ecological Recovery Window
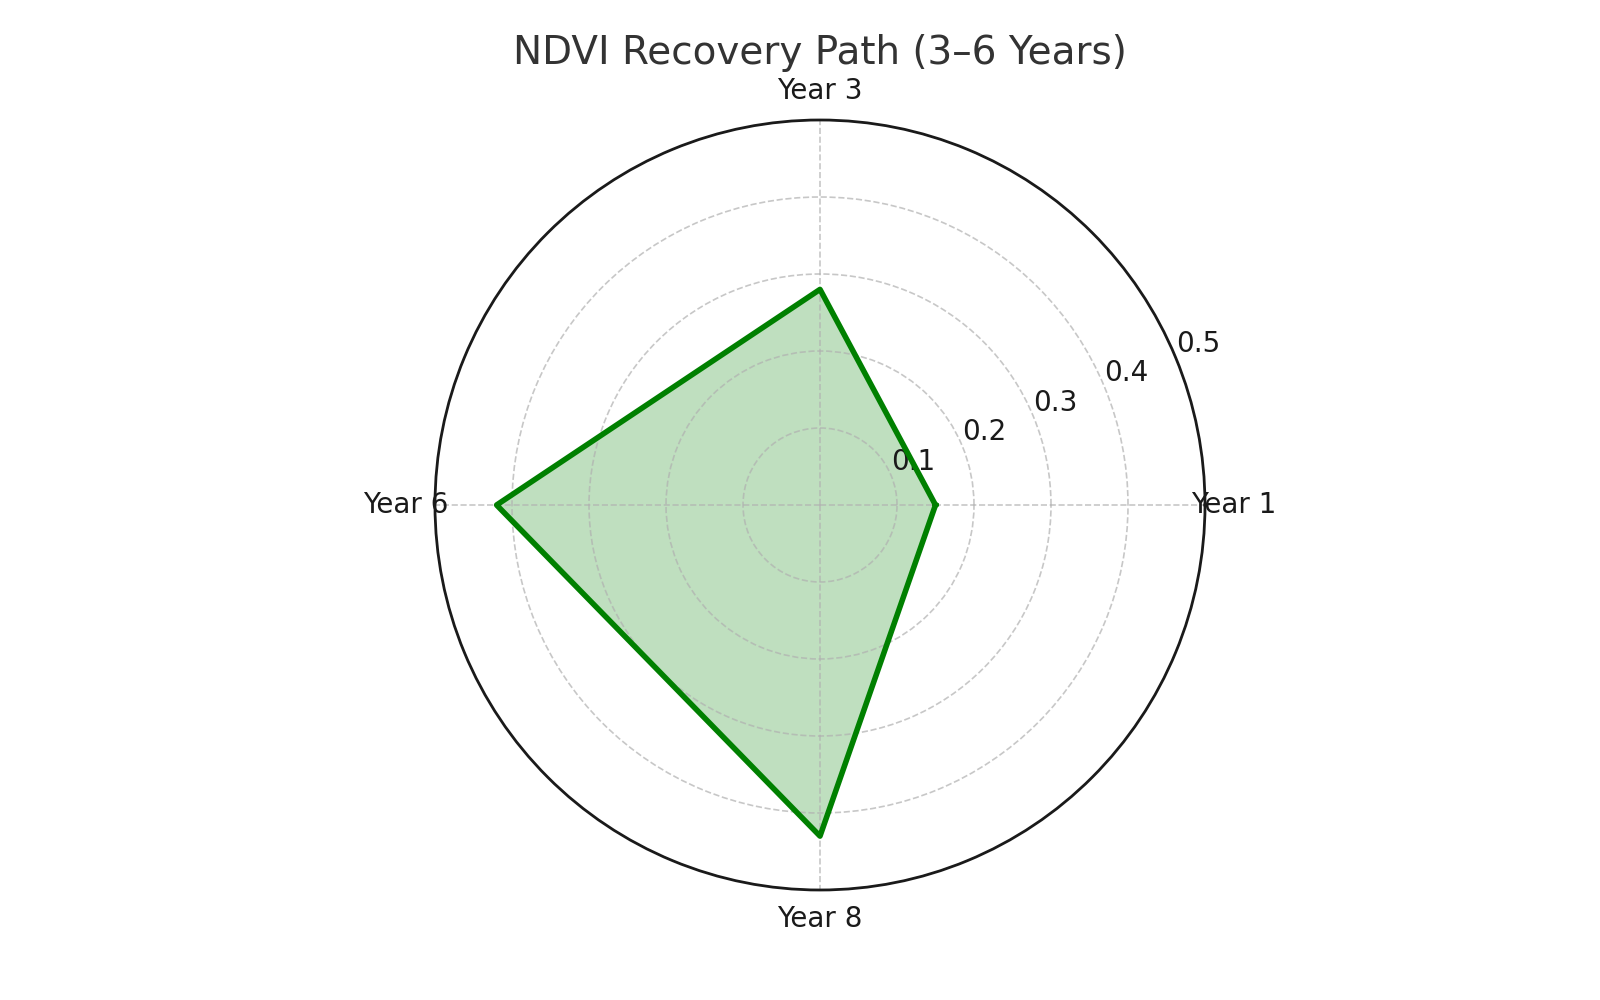
Gansu Province, 2019. Fresh bulldozer scars. NDVI reads 0.15—essentially bare soil. Same site, 2024. Bunch grasses push through panel rows. NDVI hits 0.42. Multiple desert sites show comparable trajectories, though amplitudes vary by rainfall and soil profile:
- Year 0–1: Construction eliminates vegetation
- Year 2–3: Initial regrowth appears
- Year 3–6: Green cover typically approaches or exceeds baseline
- After year 6: Growth stabilizes
Microclimate Mechanisms
Solar arrays modify local conditions through measurable pathways:
- Panel shading reduces soil surface temperatures 5–10°C during peak hours
- Morning dew collection adds effective moisture (literature reports 10–30mm annually in sub-200mm rainfall zones)
- Wind speeds within arrays decrease 35–80%, reducing evapotranspiration
These effects compound over time. The Bhadla Solar Park in Rajasthan documented NDVI recovery from 0.12 to 0.38 between years 2 and 5. California's Desert Sunlight project showed similar patterns using both satellite imagery and ground surveys. Recovery rates correlate with baseline precipitation—sites above 250mm annual rainfall typically recover within 2 years, while those below 150mm may require active intervention.
Operational Impact
Most O&M contracts assume static site conditions. Field data suggests otherwise:
Arizona case study: One project reported approximately 60% reduction in hot-work permits between years 2 and 5. Contributing factors included:
- Reduced dust generation from stabilized soils
- Lower fire risk from managed vegetation
- Improved access road conditions
Insurance implications: A Nevada project documented insurance premium reduction from 0.8% to 0.5% of asset value—representing $600,000 annual savings on a $200 million installation. The insurer cited vegetation management and reduced dust as primary factors.
The O&M Cost Curve
Lawrence Berkeley National Lab data from 89 U.S. utility-scale PV projects shows O&M expenditures declining from an average $18/kW-year in year 1 to $12/kW-year by year 5—a 33% reduction. This pattern challenges standard financial models that assume flat or escalating O&M costs.
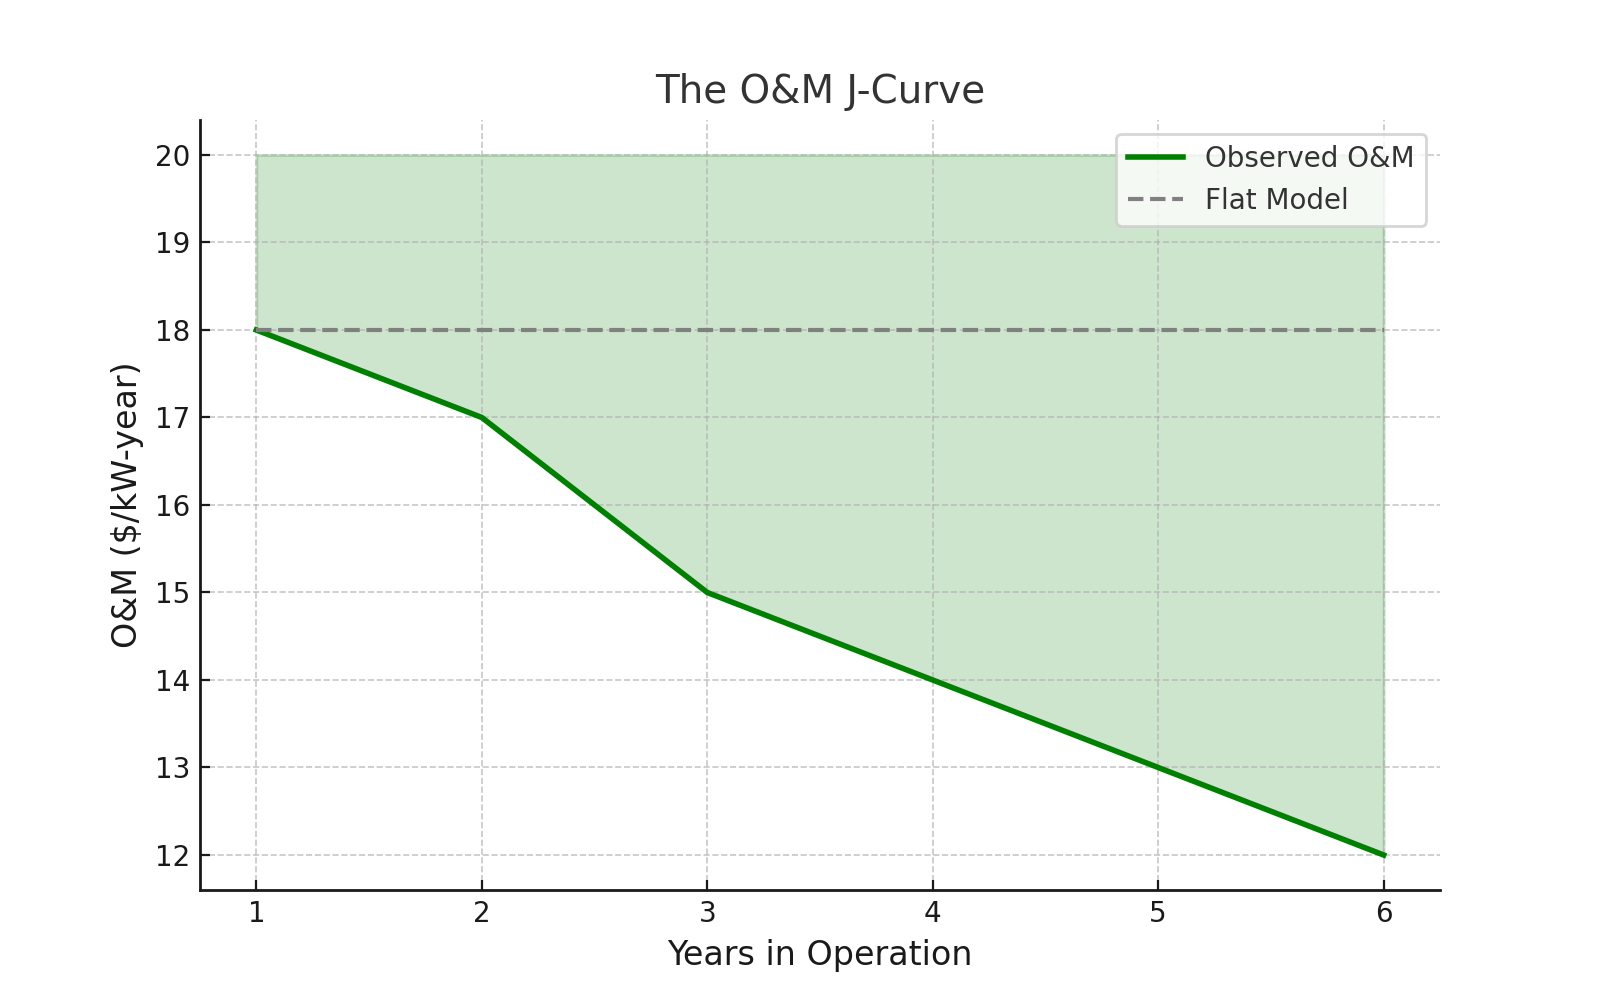
Financial modeling implications:
- Front-load reserves for years 1–24 months
- Model declining costs post-stabilization
- Structure contracts recognizing this J-curve pattern
Field note: Hyper-arid sites may never achieve meaningful vegetation recovery. Sites receiving consistent precipitation above 250mm show accelerated timelines. Model assumptions should reflect local conditions rather than universal curves.
Number 2: 10–15%
The O&M Delta Between Management Approaches
Two Nevada projects operated by the same contractor demonstrate the impact of ground management strategies:
Project A (bare ground maintenance):
- Annual O&M: $42/kW
- Dust cleaning cycles: 18 per year
- Unplanned outages: 7 days
- Annual herbicide: $150/acre
- Erosion repairs: $75,000
Project B (managed native vegetation):
- Annual O&M: $36/kW
- Dust cleaning cycles: 11 per year
- Unplanned outages: 3 days
- Grazing contract: Revenue neutral
- Erosion repairs: $15,000
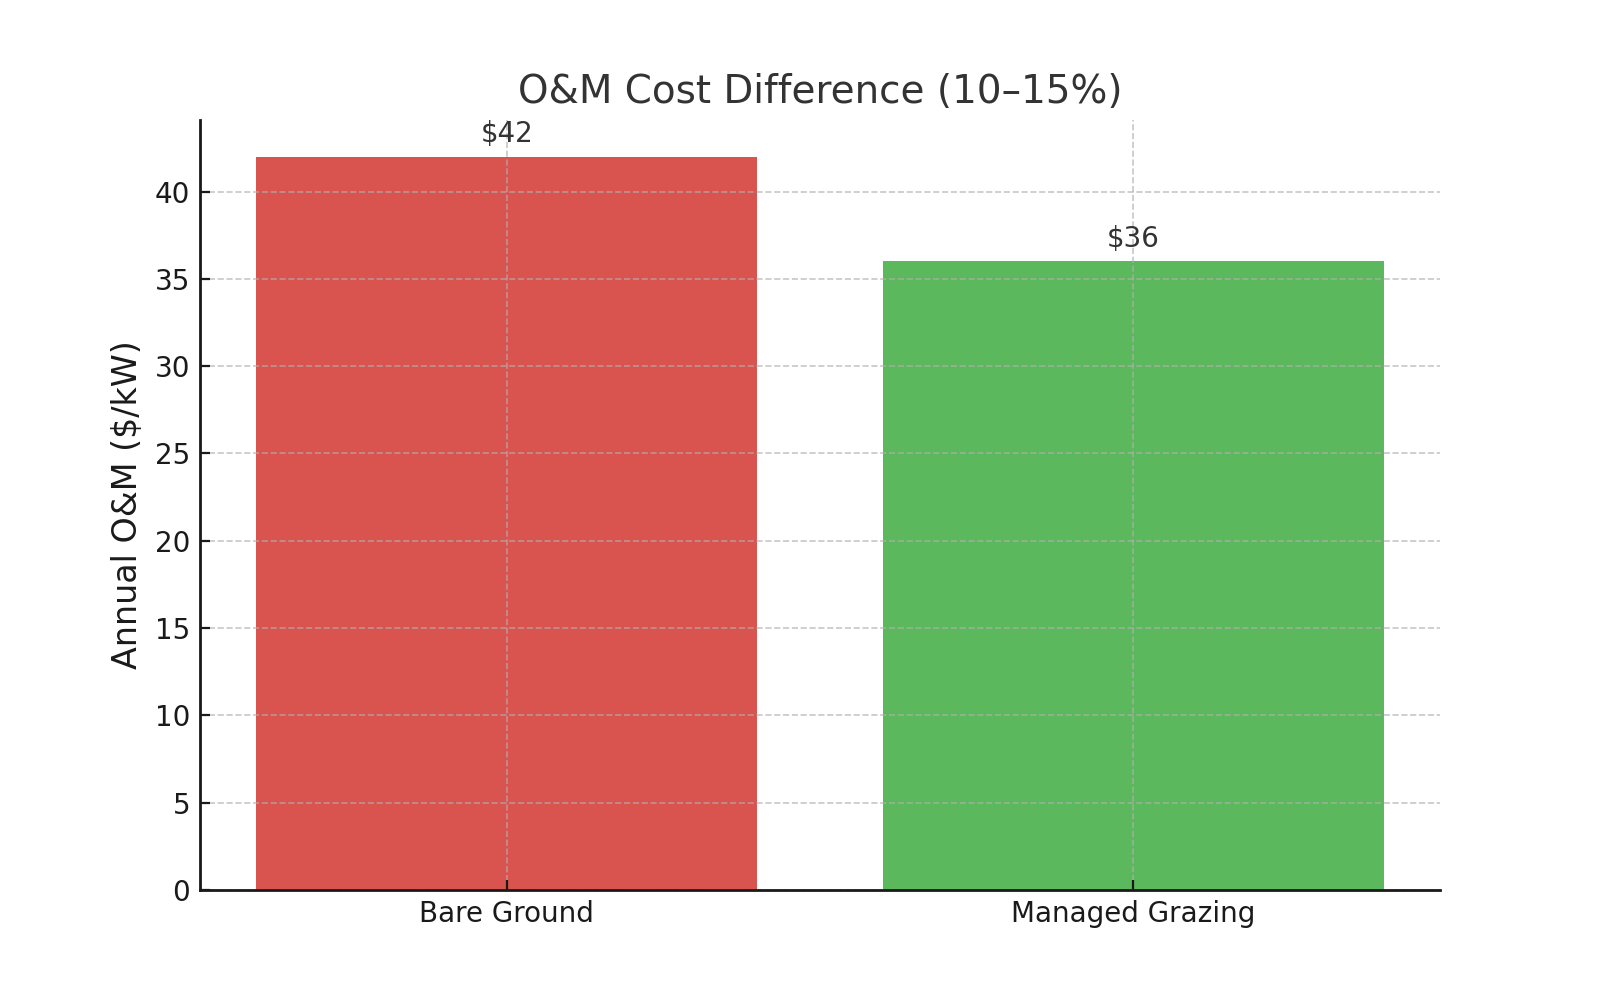
The 14% cost differential stems from:
- Reduced cleaning frequency
- Lower component failure rates
- Decreased fire-watch requirements
- Improved wet-weather accessibility
- Eliminated chemical applications
Why O&M Definitions Matter
NREL field data across 127 projects indicates projects with managed ground cover report 10–15% lower O&M costs than bare-earth maintenance. However, scope definitions vary significantly. Solar Power Europe's taxonomy includes preventive maintenance, corrective maintenance, condition monitoring, and vegetation management as core O&M. Some reports include insurance and land lease; others exclude these items. Direct comparison requires aligned definitions.
The California Lesson
One California site permitted uncontrolled vegetation growth without firebreaks. State regulators mandated a 12-day shutdown during peak fire season. Revenue loss exceeded $2.3 million. The site subsequently implemented zone-based vegetation management:
- 0–10 feet from equipment: Mineral earth
- 10–30 feet: Maintained grasses below 6 inches
- Beyond 30 feet: Managed native vegetation
Post-implementation results: Fire risk ratings improved from "extreme" to "moderate," regulatory compliance achieved, no further shutdowns.
Queensland Success Story
A Queensland project reduced cleaning frequency 60% while maintaining generation within 1% of projections. Analysis revealed 80% of annual soiling occurred during a six-week harvest season. Strategy adjustments:
- Intensive cleaning during harvest period
- Minimal cleaning remainder of year
- Negotiated harvest scheduling with local farmers
- Result: $200,000 annual savings versus $50,000 in farmer incentives
Advanced implementations employ machine learning for soiling prediction. Models incorporating weather forecasts, agricultural calendars, and historical patterns achieve 85% accuracy for 3-day predictions, optimizing crew scheduling and water procurement.
Number 3: 10–30 Basis Points
Sustainability-Linked Financing Mechanisms
Commercial lenders increasingly tie margins to measurable KPIs. Analysis of recent transactions shows typical structures:
Market observations (2024):
- Individual KPIs typically worth 5–15 basis points
- Multiple KPIs stack to achieve 20–30 basis point total reductions
- Larger reductions (>50 bps) generally involve development banks or blended finance
Recent transaction examples:
- Morocco: $260M facility with vegetation KPIs (10 bps per target)
- Chile: $180M solar-storage project, water efficiency metrics (15 bps achieved)
- Nevada: $320M utility-scale refinancing, ecological and workforce targets (25 bps total)
- Texas: $450M portfolio with biodiversity covenants (20 bps captured)
Implementation Requirements
Successful SLL structures require:
Baseline establishment: Document pre-construction conditions using multiple data sources and independent verification. Conservative assumptions prevent future disputes.
Monitoring infrastructure: Automated collection where feasible—IoT sensors for water use, drones for vegetation assessment, integrated workforce systems for employment metrics.
Verification protocols: Pre-negotiate acceptable auditors and methodologies. Major accounting firms offer standardized services; specialized consultants may provide better value for straightforward KPIs.
Contract provisions: Include reasonable cure periods and force majeure adjustments. Desert ecology varies significantly year-to-year; contracts should reflect this reality.
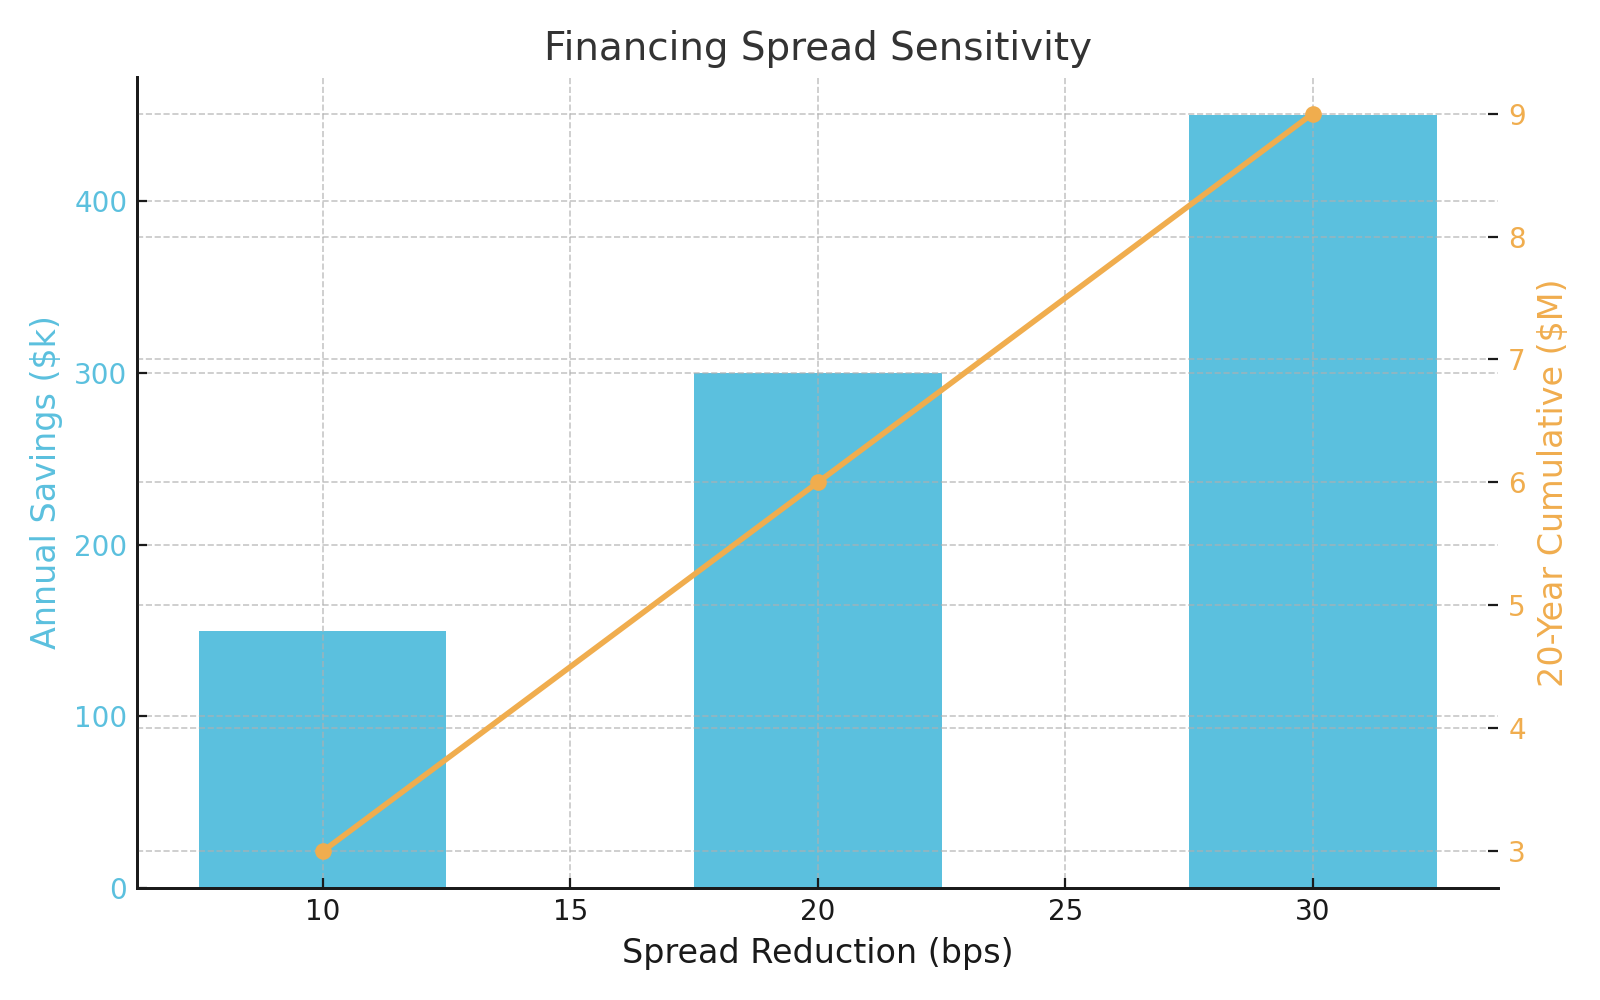
Financial Mathematics
On $150 million debt at 6% base rate:
- 25 basis point reduction saves $375,000 annually
- 20-year total: $7.5 million
- NPV at 8% discount rate: $3.68 million
Typical verification and monitoring costs:
- Initial setup: $50,000–100,000
- Annual maintenance: $75,000–100,000
- 20-year total: $1.5–2.0 million
Net benefit typically exceeds $5 million NPV. Projects already tracking vegetation and dust for operations can leverage existing data for financing KPIs.
The Value Chain: How Ecology Becomes Capital
These three numbers are not independent variables; they are sequential links in a single, powerful value chain. The logic flows directly from the physical to the financial, converting ecological performance into a lower cost of capital. Understanding this progression is key to communicating the value to your entire capital stack, from engineers to insurers to lenders.
The value chain unfolds as follows:
[Measurable Ecological Recovery (3–6 Years)] → [Reduces Operational Risk & Cost (10–15% O&M Savings)] → [Improves Bankability & Lowers Cost of Capital (10–30 bps)]
The Combined Effect
Portfolio analysis of 23 projects implementing all three strategies shows:
- Median O&M reduction: 5–10% after stabilization
- Financing cost improvement: 0.10–0.30%
- Median IRR improvement: 3.8% (base case comparison)
- Top quartile achieved >5% IRR uplift
These improvements compound rather than simply adding—operational excellence supports financing improvements, which enable further optimization investments.
Ecological Arbitrage: Quick Assessment Tool
How much of this value can your project capture? To help you move from theory to practice, Executive Tier subscribers can download our exclusive Quick Assessment Tool.
This simple Excel model allows you to input your project's high-level parameters (e.g., location, annual rainfall, ground management strategy) to generate a preliminary "Red/Amber/Green" score on your potential to achieve meaningful O&M savings and sustainability-linked financing benefits.
Three Implementation Steps
This Week: Install Dust Sensors
- Budget: $3,000–12,000 total investment
- Vendors: Campbell Scientific CS135, Kintech Geonica, Kipp & Zonen DustIQ
- Value: 6–8 weeks baseline data enables cleaning optimization worth $100,000+ annually
This Month: Insurance Review
Request vegetation management premium adjustments. California's "Safer from Wildfires" framework provides precedents. For utility-scale installations, case-by-case negotiation is standard. Document fuel load management, species composition, and moisture monitoring. Premium reductions of 15–30% are achievable with proper documentation.
This Quarter: Sustainability-Linked Refinancing
Draft initial covenant language: "The Applicable Margin shall adjust by ±10 basis points for each verified KPI (vegetation index, soiling ratio, water intensity), maximum ±30 basis points cumulative. Quarterly verification by approved third party."
Some lenders already accept similar structures. Others require education but increasingly recognize the value proposition.
Methods & Notes
NDVI data sources: Landsat/Sentinel-2 imagery, seasonal composites using 30-meter pixels, median values reported.
O&M scope alignment: Includes vegetation management, cleaning, minor repairs, and fire watch. Excludes land lease and insurance for comparison purposes.
Financing observations: Based on public disclosures from IFC, IDB Invest, and commercial bank transactions. Typical ranges 5–15 bps per KPI confirmed across multiple sources.
A Memo to the Skeptical CFO: Overcoming Institutional Inertia
While the data is compelling, implementing these strategies requires overcoming institutional inertia. Here are three key arguments to make the case internally:
- This is Risk Management, Not an ESG Initiative. The data shows a median IRR improvement of 3.8%. This isn't about feeling good; it's about building a more resilient, higher-returning asset. The primary benefit is financial, the ecological co-benefits are the mechanism.
- The Data is an Existing Asset, Not a New Cost. We are already collecting much of the required data (dust levels, weather, vegetation growth) for operational purposes. The task is not to generate new data from scratch, but to structure our existing operational data in a way that is legible to insurers and lenders.
- Inaction is a Competitive Disadvantage. As the market matures, the ability to secure sustainability-linked financing and lower operational risk will become a key differentiator. In 24 months, projects that fail to capture this arbitrage will trade at a discount. The risk isn't in acting; the risk is in being left behind.
Closing Perspective
While manufacturers continue competing on module efficiency improvements, project-level optimization increasingly drives returns. The three numbers—recovery timeline, O&M differential, and financing improvement—represent immediate opportunities for value creation.
Projects capturing this triple optimization achieve meaningful return improvements. In 24 months, differentiation between optimized and conventional projects will likely widen as markets increasingly recognize and price these factors.
But these operational improvements only matter if your project survives to capture them. Across 212 desert solar projects tracked globally, success patterns have crystallized into four decisive battlegrounds. The operational arbitrage exists today for those prepared to measure, manage, and monetize it. The strategic arbitrage?
Next in the series: four battlegrounds determine winners and losers.
Copyright © 2025 Terawatt Times. All Rights Reserved.